
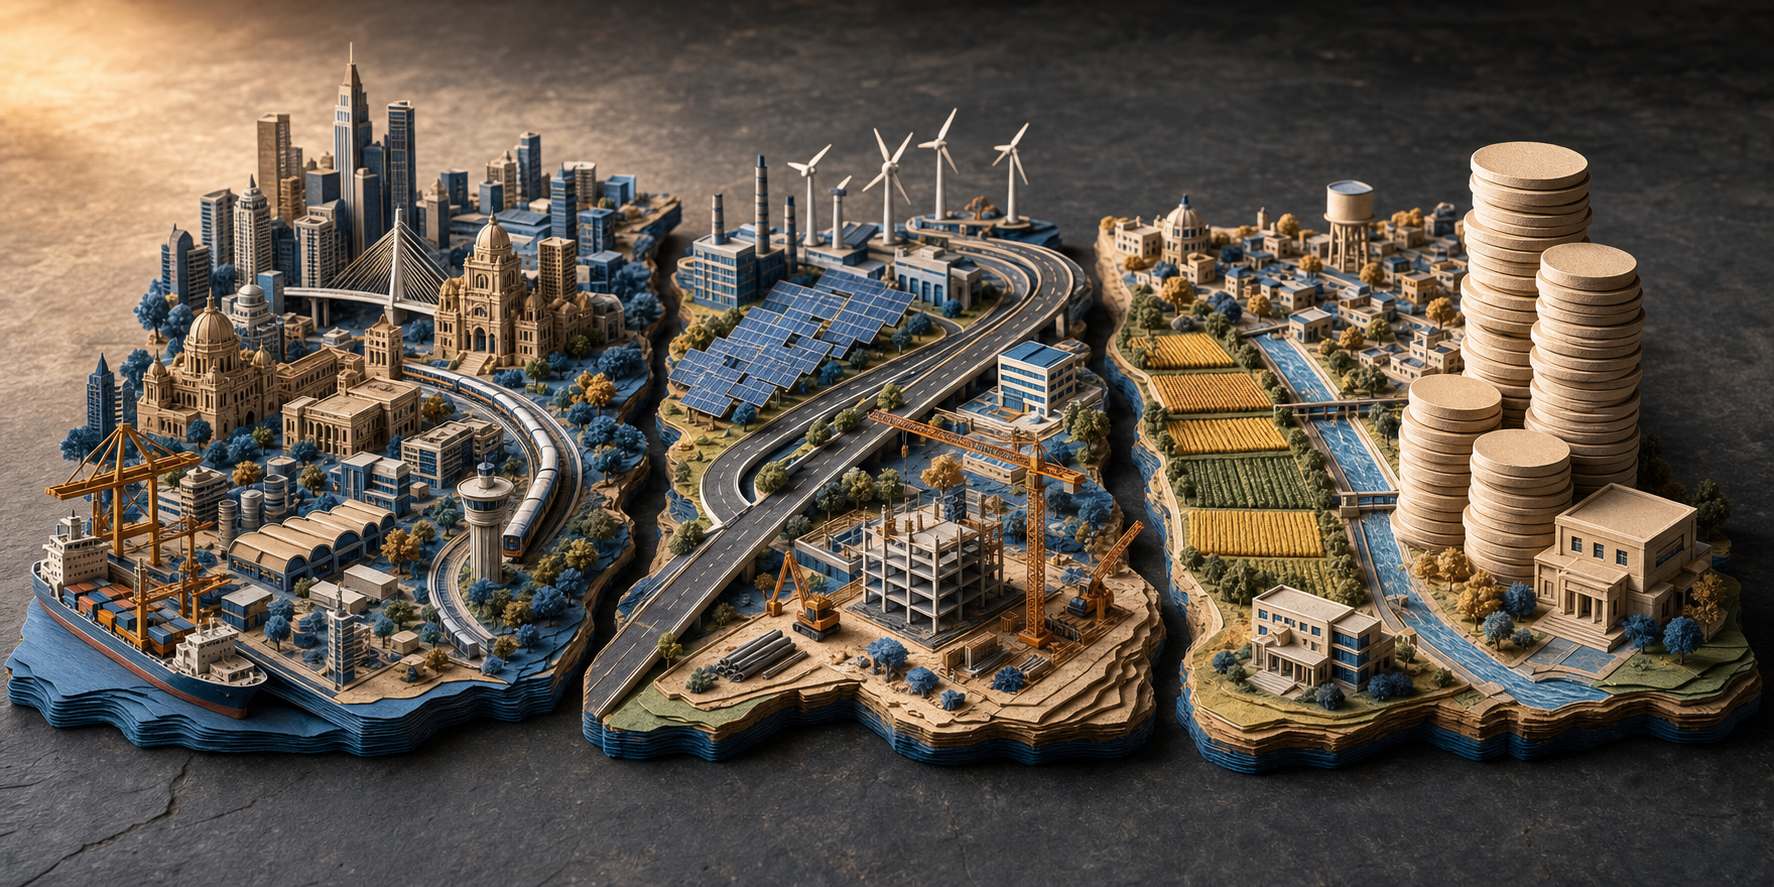
Three state budgets with very different constraints cannot be judged by headline size alone. Source-reported figures for 2024-25 show Maharashtra operating at the greatest scale, Gujarat giving capital outlay a markedly larger share than Maharashtra, and Punjab carrying a debt-repayment burden that sharply reduces its usable fiscal space.
A meaningful comparison must therefore separate debt repayment from programme expenditure, recurring commitments from investment, and budget estimates from actual results. All figures below are attributed to the supplied DharmaRenaissance Blog article and have not been independently verified or updated.
Key takeaways
- Net expenditure excluding debt repayment was budgeted at ₹6,12,293 crore in Maharashtra, ₹2,99,362 crore in Gujarat and ₹1,35,051 crore in Punjab.
- Punjab budgeted ₹69,867 crore for debt repayment, more than Maharashtra’s ₹57,198 crore and Gujarat’s ₹29,085 crore despite having the smallest projected economy of the three.
- Gujarat directed 25.3 per cent of its net expenditure to capital outlay, compared with 13.9 per cent in Maharashtra; this indicates a stronger investment orientation, but not automatically better projects or outcomes.
- Maharashtra executed most of its planned expenditure, yet weaker-than-budgeted receipts contributed to revenue and fiscal deficits exceeding their original estimates.
- No single indicator produces a defensible overall ranking: scale, revenue autonomy, capital formation, fixed commitments, debt service and execution answer different fiscal questions.
A common denominator changes the comparison

The cited article reports approximate total 2024-25 outlays of ₹6.0 trillion for Maharashtra, ₹3.3 trillion for Gujarat and ₹2.0 trillion for Punjab. It also cautions that headline totals can incorporate debt repayment differently. Expenditure excluding debt repayment is consequently the cleaner starting point for comparing resources assigned to services, assets and lending.
| 2024-25 budget measure | Maharashtra | Gujarat | Punjab |
|---|---|---|---|
| Projected nominal GSDP | ₹42.68 lakh crore | ₹27.9 lakh crore | ₹8.03 lakh crore |
| Net expenditure excluding debt repayment | ₹6,12,293 crore | ₹2,99,362 crore | ₹1,35,051 crore |
| Debt repayment | ₹57,198 crore | ₹29,085 crore | ₹69,867 crore |
| Revenue expenditure | ₹5,19,514 crore | ₹2,19,832 crore | Not stated in the supplied passage |
| Capital outlay | ₹85,292 crore | ₹75,689 crore | Not stated in the supplied passage |
| Capital outlay as share of net expenditure | 13.9% | 25.3% | Not stated in the supplied passage |
The denominator issue is most consequential for Punjab. Its debt-repayment provision was slightly more than half the size of its net expenditure excluding repayment. A large gross budget in such circumstances does not imply a correspondingly large pool for schools, hospitals, infrastructure or agricultural services.
Net expenditure is not the same as freely adjustable spending, however. It still includes salaries, pensions, interest and other recurring obligations. Comparisons must move from gross totals to net expenditure and then examine how much of that net amount remains flexible.
Fiscal capacity and spending composition point in different directions
Maharashtra’s principal advantage was the breadth of its economic and revenue base. The source reports projected revenue receipts of ₹4,99,463 crore, with approximately 74 per cent expected from the state’s own resources. That degree of own-revenue capacity can provide more autonomy than heavy dependence on intergovernmental transfers. Nevertheless, Maharashtra budgeted a revenue deficit of ₹20,051 crore and a fiscal deficit of ₹1,10,355 crore.
Its flexibility was also limited by ₹2,75,615 crore budgeted collectively for salaries, pensions and interest. These are not inherently unproductive expenses: salaries operate public institutions, pensions honour service obligations, and interest preserves creditworthiness. Their fiscal importance lies in their rigidity, because they leave less room to respond to shocks or begin new programmes.
Gujarat presented a different combination. The article reports a budgeted revenue surplus of ₹9,821 crore and a fiscal deficit of ₹51,917 crore, equivalent to about 1.9 per cent of projected GSDP. Its reported committed expenditure of ₹1,05,357 crore represented about 46 per cent of projected revenue receipts. Alongside a 25.3 per cent capital-outlay share, those figures describe a budget with comparatively greater room for asset creation.
That orientation should not be confused with a completed development result. Capital outlay can improve transport, irrigation, water security and urban infrastructure, but its value depends on project selection, timely completion, utilisation and later maintenance. A revenue surplus likewise establishes that recurring receipts are expected to cover recurring expenditure; it does not prove that each programme is efficient.
Punjab’s central problem is fiscal space. The source characterises the state as operating with a smaller economic base, slower structural diversification, high committed expenditure and substantial inherited debt. Its ₹69,867 crore debt-repayment provision exceeded those of both larger states in absolute terms. This places pressure on current policy choices before the quality of individual programmes is even considered.
The cited passage does not provide Punjab’s corresponding revenue-expenditure and capital-outlay figures. A symmetrical three-state ranking on investment intensity therefore cannot be supported from the supplied material. What can be concluded is narrower but important: debt service consumes an unusually prominent part of Punjab’s budget framework.
Execution reveals risks hidden by budget estimates
A budget records intent; actual accounts show how revenue and spending behaved. For Maharashtra, the source reports actual net expenditure of ₹6,06,810 crore, approximately one per cent below the ₹6,12,293 crore estimate. Capital outlay reached ₹82,773 crore, about three per cent below its ₹85,292 crore provision. On the expenditure side, the state therefore remained close to plan.
The revenue side was less favourable. Actual revenue receipts were reported to be four per cent below estimate, while Union grants were 37 per cent below the budgeted amount. Maharashtra’s revenue deficit consequently reached ₹29,995 crore, 50 per cent above its original estimate, and its fiscal deficit rose from the budgeted ₹1,10,355 crore to ₹1,24,209 crore.
This is a mixed performance rather than a simple success or failure. Maharashtra largely protected planned spending and capital outlay, but did so while its financing gap widened. The result highlights two separate aspects of fiscal management: departments may execute allocations effectively even when revenue forecasts or expected transfers prove optimistic.
Comparable actual figures for Gujarat and Punjab are not stated in the supplied passage. Gujarat’s capital orientation is therefore a conclusion about its budget plan, not evidence that every allocation was ultimately spent. A fair comparison of realised performance would require the same actual-receipt, actual-expenditure and deficit measures for all three states.
A fair fiscal scorecard must test more than borrowing

The three states should be assessed through a sequence of related tests:
- Use expenditure excluding debt repayment to determine the resources actually available for services, investment and lending.
- Relate spending and deficits to economic capacity rather than treating absolute rupee totals as directly comparable.
- Measure recurring commitments against recurring receipts to identify how much of the budget remains adjustable.
- Distinguish capital allocation from completed, functioning and maintained public assets.
- Compare budget estimates with actual accounts to expose revenue shortfalls, underspending and deficit slippage.
- Pair financial ratios with service quality and social outcomes, since neither revenue nor capital accounting alone establishes public value.
On the disclosed measures, Gujarat had the strongest capital orientation and a planned revenue surplus. Maharashtra had the greatest scale, strong own-revenue capacity and close expenditure execution, but its actual deficits deteriorated when receipts fell short. Punjab faced the tightest evident constraint because an exceptionally large debt-repayment provision competed with a much smaller programme budget. These are dimension-specific findings, not an overall league table.
Future comparisons should track whether Maharashtra restores revenue balance without weakening productive expenditure, whether Gujarat converts capital provisions into durable assets, and whether Punjab can reduce debt pressure while preserving essential services and investment. Progress on those questions will matter more than the size of the next headline budget.