

If you are trying to decide whether Bharat has truly become a photovoltaic manufacturing power, the 172 GW headline is encouraging but incomplete. It tells you that the industrial base has changed dramatically. It does not, by itself, tell you how much equipment is operating, how much of the supply chain is domestic, or whether manufacturers can compete without policy protection.
The right response is neither cynicism nor premature triumph. Bharat has built a serious platform from which deeper solar self-reliance can emerge. You can judge the next stage by looking beyond factory announcements and asking what those factories produce, where their inputs come from, who buys their output, and whether the businesses remain viable.
What the 172 GW figure proves – and what it cannot prove
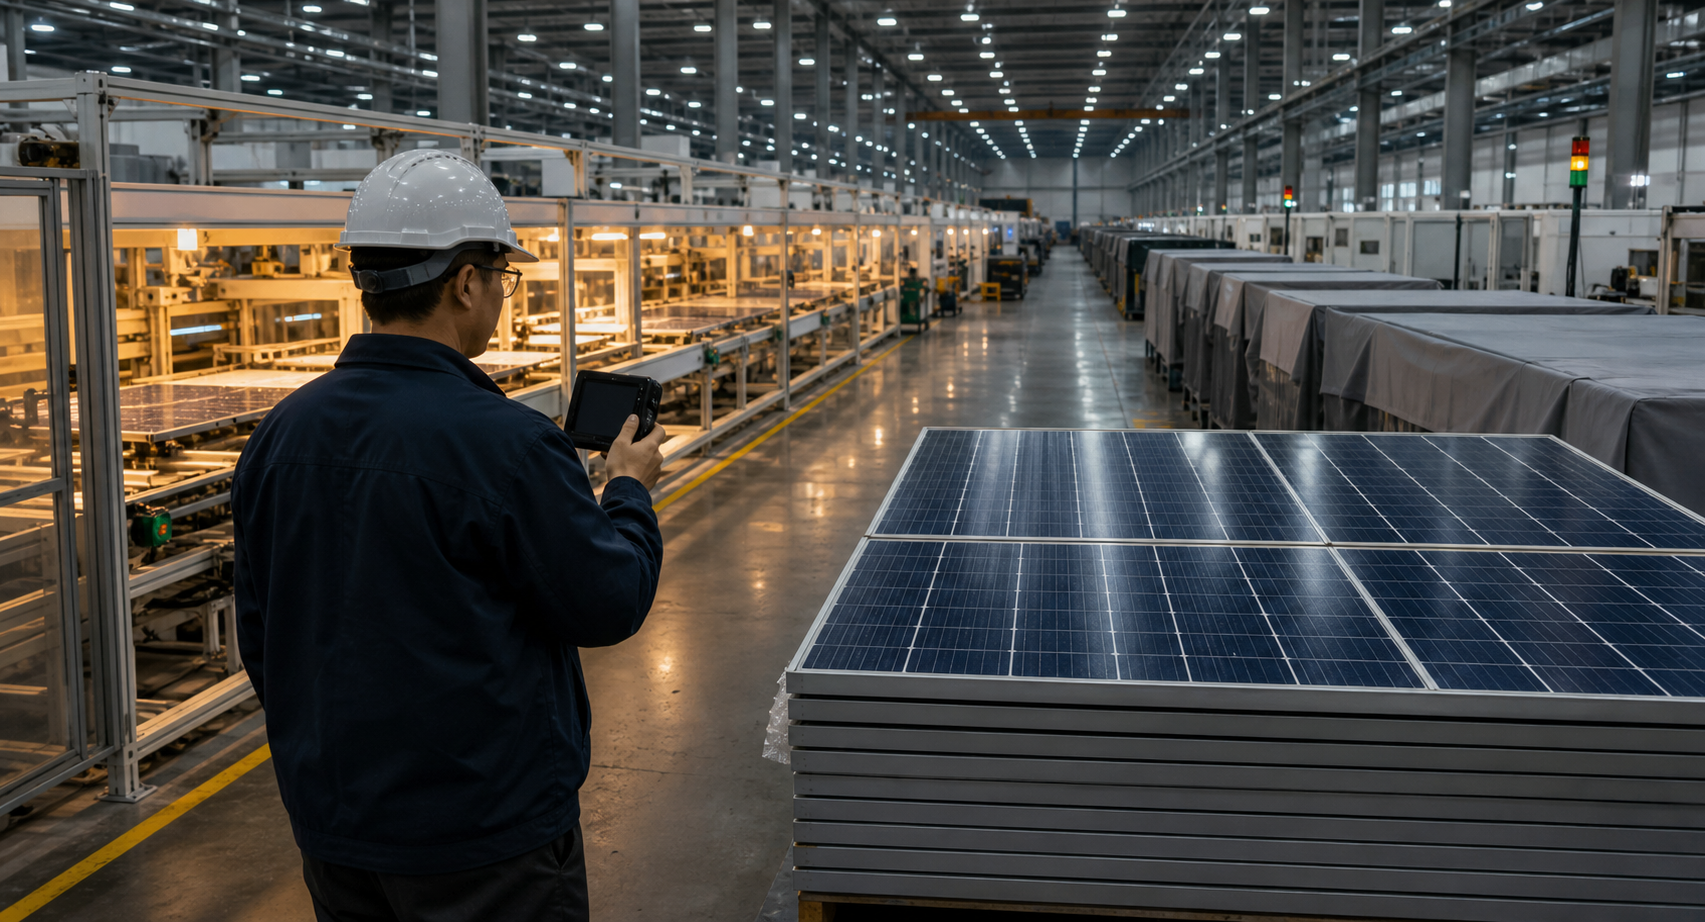
Bharat’s photovoltaic-module production capacity increased from less than 10 GW in 2018 to 172 GW in 2026. That is a seventeen-fold expansion in eight years. Growth on this scale means that domestic manufacturing is no longer a marginal extension of the installation market. Factories, capital, suppliers, workers and policy have begun to form an industrial base.
Capacity, however, is not the same as production. A factory’s stated annual capacity is generally its nameplate ability under defined operating assumptions. Actual output depends on orders, utilization, downtime, yields, working capital and the availability of components. A 172 GW capacity figure therefore does not mean that 172 GW of modules necessarily left Bharatiya factories during the year.
Module capacity also measures one stage of a longer chain. Solar cells must be produced before they are interconnected and packaged into modules. Those cells depend on wafers, and wafers depend on processed silicon and earlier material stages. Glass, frames, encapsulants, junction boxes, production equipment and other inputs sit around that core chain. A country can possess substantial module capacity while remaining exposed at several upstream points.
When you encounter a manufacturing claim, separate four questions that are often collapsed into one:
- Installed capacity: How much could the factories make if fully operational?
- Actual output: How many modules or cells did they manufacture and ship?
- Domestic value: Which stages and inputs were completed or produced inside Bharat?
- Commercial strength: Did customers choose the output in open competition, and could the manufacturer earn sustainable returns?
The 172 GW milestone answers the first question for modules. It is still an important answer. We should recognize it as evidence of industrial scale while keeping the other three questions open.
Three policies changed the economics of making modules in Bharat
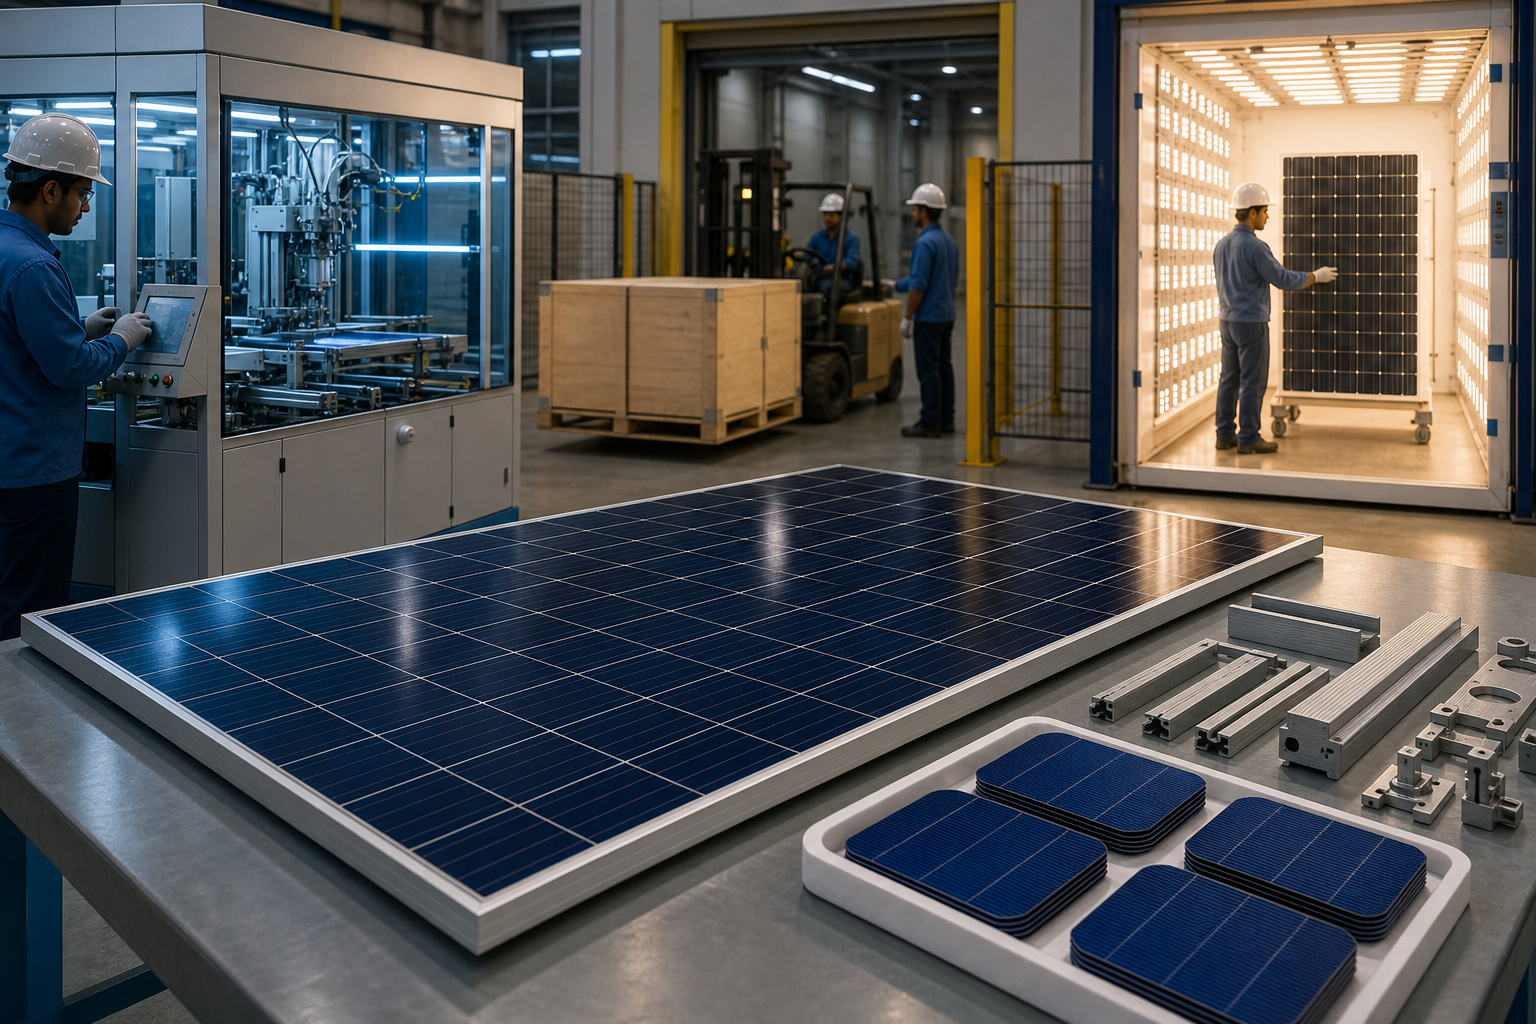
This expansion did not arise from market demand alone. Three policy instruments – the Production-Linked Incentive scheme, Basic Customs Duty and the Approved List of Models and Manufacturers – altered the incentives facing manufacturers and buyers. Each works at a different point in the commercial decision.
| Policy instrument | Immediate function | What you should examine next |
|---|---|---|
| Production-Linked Incentive scheme | Encourages companies to establish manufacturing facilities in Bharat. | Whether approved capacity becomes commissioned equipment, regular output and durable industrial capability. |
| Basic Customs Duty | Places tariffs on imported components and changes the relative economics of importing versus producing locally. | Whether the protected period is being used to improve scale, efficiency and supply-chain depth. |
| Approved List of Models and Manufacturers | Makes certification a condition for participation in government projects. | Whether access to government demand leads to consistent quality and sales beyond the protected project channel. |
The interaction matters. An incentive can make a factory investment more attractive. A customs duty can make an imported alternative less attractive. A procurement rule can give approved manufacturers access to a large body of demand. Applied together, these measures can move a market from import dependence toward local capacity much faster than any one measure acting alone.
But policy success has two stages. The first is getting factories built. The second is ensuring that those factories become productive, technically capable and commercially resilient. If the second stage does not follow, installed capacity can remain underused or permanently dependent on protection.
When assessing these policies, do not ask only whether imports fell or factories opened. Ask whether manufacturers are learning to lower costs, maintain quality, secure upstream inputs and win customers who have alternatives. The strongest proof will be firms that can survive ordinary competitive pressure after the initial policy-assisted expansion.
China’s anxiety is a signal, not a certificate of success
The strategic relationship has plainly changed. Bharat moved from being a net importer in the 2000s to a position that Chinese assessments describe as the world’s second-largest photovoltaic-module manufacturing base. Chinese public discussion is no longer treating Bharat merely as a downstream buyer. It is treating Bharat as an emerging competitor.
That reaction deserves attention because established producers notice when a former customer begins building competing scale. It is not, however, an independent audit of Bharat’s manufacturing depth. A rival’s alarm can reveal a perceived strategic threat without proving that every weakness in the new industrial base has been resolved.
The contrast became sharper as Chinese manufacturers entered severe financial difficulty. In 2025, 11 of 15 listed Chinese photovoltaic companies reported combined losses of about 50 billion yuan. TCL Zhonghuan, Jinko Solar, Longi Green Energy, JA Solar and Trina Solar together accounted for losses exceeding 28 billion yuan.
Those numbers establish that major Chinese producers were under considerable financial pressure. They do not establish that Bharat’s expansion caused their losses. Two developments can occur at the same time without one fully explaining the other. Conflating the Indian capacity boom with the Chinese profit collapse may produce a satisfying geopolitical story, but it skips the evidence needed to demonstrate causation.
Chinese online critics also alleged that technology transfer enabled Bharat’s gains and accused Chinese businesses of helping a competitor. These are claims made within Chinese public opinion, not verified proof that Bharat’s entire rise can be reduced to transferred technology. Industrial capability involves more than obtaining a production method. It also requires capital deployment, factory execution, worker skills, supplier coordination, quality control, customer demand and policy continuity.
A pro-Bharat reading is strongest when it distinguishes three kinds of information: measurable Indian capacity, measurable corporate losses in China, and attributed allegations about how the shift occurred. The first two are data points. The third is a contested interpretation. Do not give all three the same evidentiary weight.
The next test is manufacturing depth, not another capacity headline
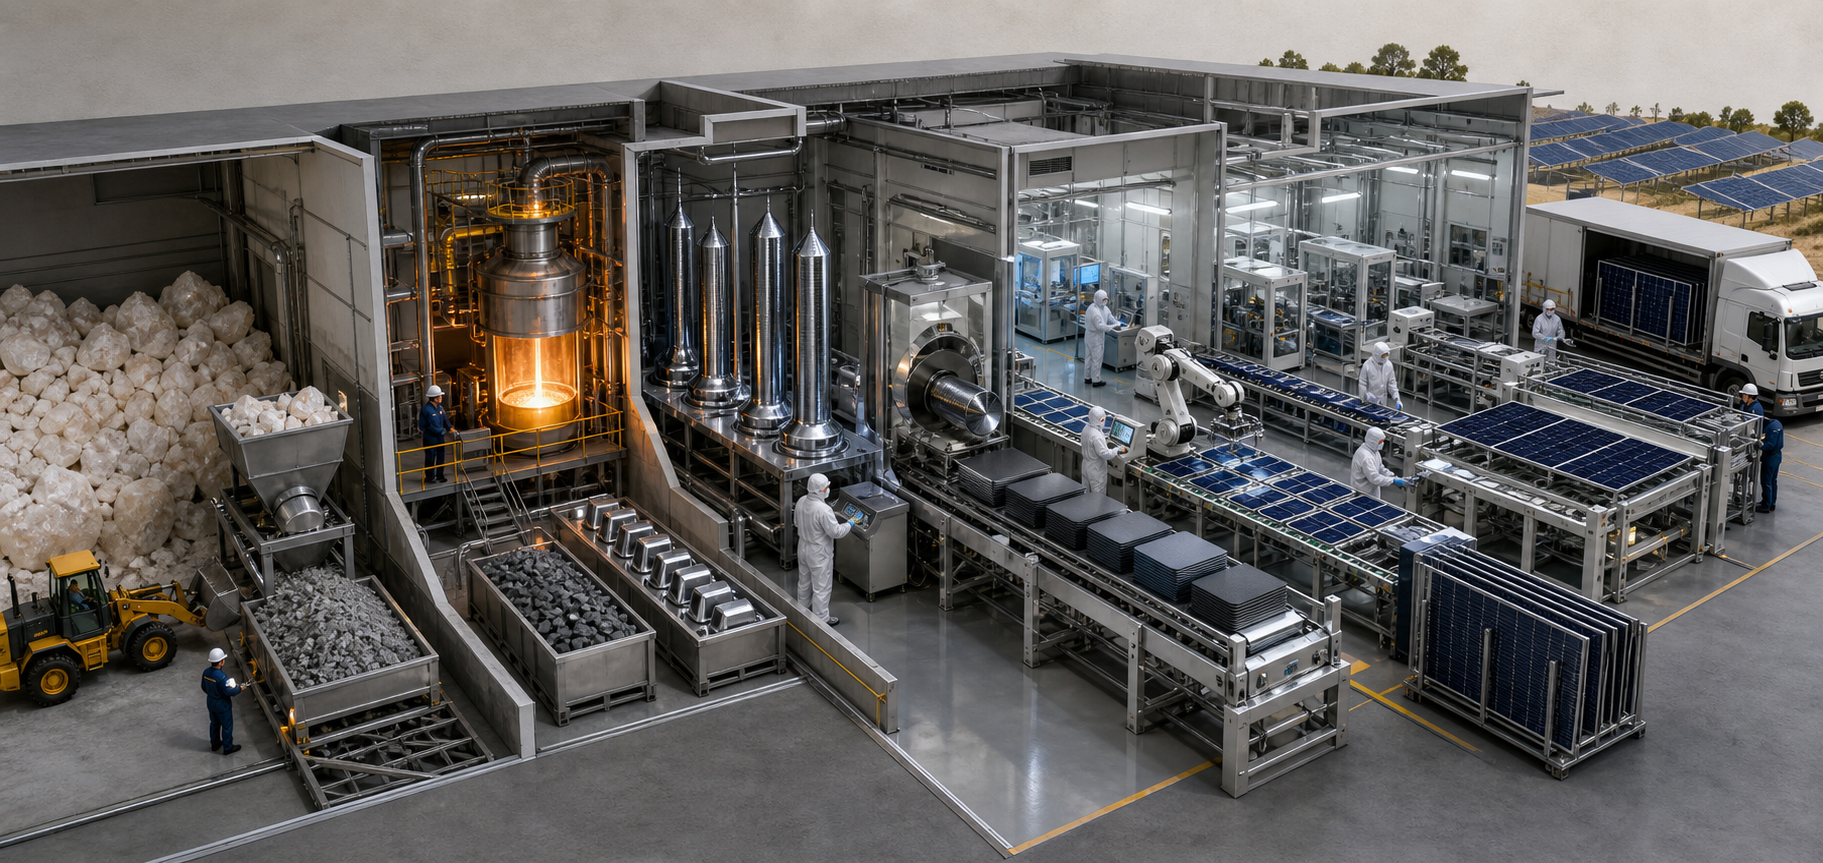
A photovoltaic module is the visible final product, but strategic control is distributed across the chain. The more stages Bharat can operate competitively, the less a disruption at one foreign source can halt domestic production. This does not require total isolation from international trade. It requires knowing where concentrated dependencies exist and ensuring that critical inputs are available from resilient sources.
Use the following five-part scorecard when new figures are released.
- Map the production stage. Determine whether a number refers to modules, cells, wafers, silicon processing or another input. Never treat module capacity as a measurement of the entire photovoltaic chain.
- Separate announced, commissioned and operating capacity. A proposed factory is an investment intention. A commissioned line is physical capability. Regular production and shipments show that the line is working commercially.
- Look for output and utilization. If capacity rises much faster than actual production, the industrial base may be real but underused. Shipment volumes and utilization give meaning to the nameplate figure.
- Trace critical inputs. Ask which materials, components and machines are domestic, which come from diversified partners, and which depend on a single external source. A foreign input is not automatically a weakness; an opaque or irreplaceable dependency can be.
- Test the customer base. Government procurement can help factories reach scale, but durable competitiveness requires repeat orders, reliable quality and customers beyond one protected channel.
Profitability belongs in this assessment as well, though one difficult year does not settle the question. A manufacturer that continuously sells below sustainable cost may add shipment volume without adding durable national capacity. Conversely, a factory that improves yields, controls costs and reinvests in technology can deepen the industrial ecosystem even before every upstream input is localized.
Technical capability should also be judged by more than possession of equipment. The practical questions are whether firms can operate lines consistently, adapt processes, maintain quality as scale increases and respond when photovoltaic technology changes. Machinery can be purchased. The organizational knowledge required to run and improve it must be built.
This is why the transition from assembly to industrial power is gradual. Module factories create demand for cells, materials, equipment maintenance, testing, logistics and skilled labour. If policy and capital follow those linkages, today’s downstream scale can become the foundation for tomorrow’s upstream depth. If those linkages remain weak, a large module number may conceal continuing external exposure.
A six-question test for the next solar manufacturing claim

Before you repeat a new claim about Bharat’s photovoltaic rise, run it through these questions:
- Does the number describe nameplate capacity, actual production or shipments?
- Which part of the supply chain does it measure?
- Is the capacity announced, commissioned or operating at meaningful utilization?
- How much of the product’s value and technical work is performed in Bharat?
- Can the manufacturer sell beyond policy-protected demand and remain financially viable?
- Is the claim supported by measurable evidence, or is it an allegation from a competitor, commentator or social-media campaign?
If only the first question can be answered, treat the claim as a capacity milestone rather than proof of complete self-reliance. If evidence begins answering all six, Bharat will have moved beyond factory expansion toward a resilient photovoltaic industry.
The immediate task is to protect the gains without becoming complacent about them. When the next solar headline appears, look for operating output, upstream capability, diversified inputs and competitive customers. That disciplined accounting will show where Bharat should invest next – and it will make the case for the country’s rise stronger than any rival’s alarm ever could.
References
