
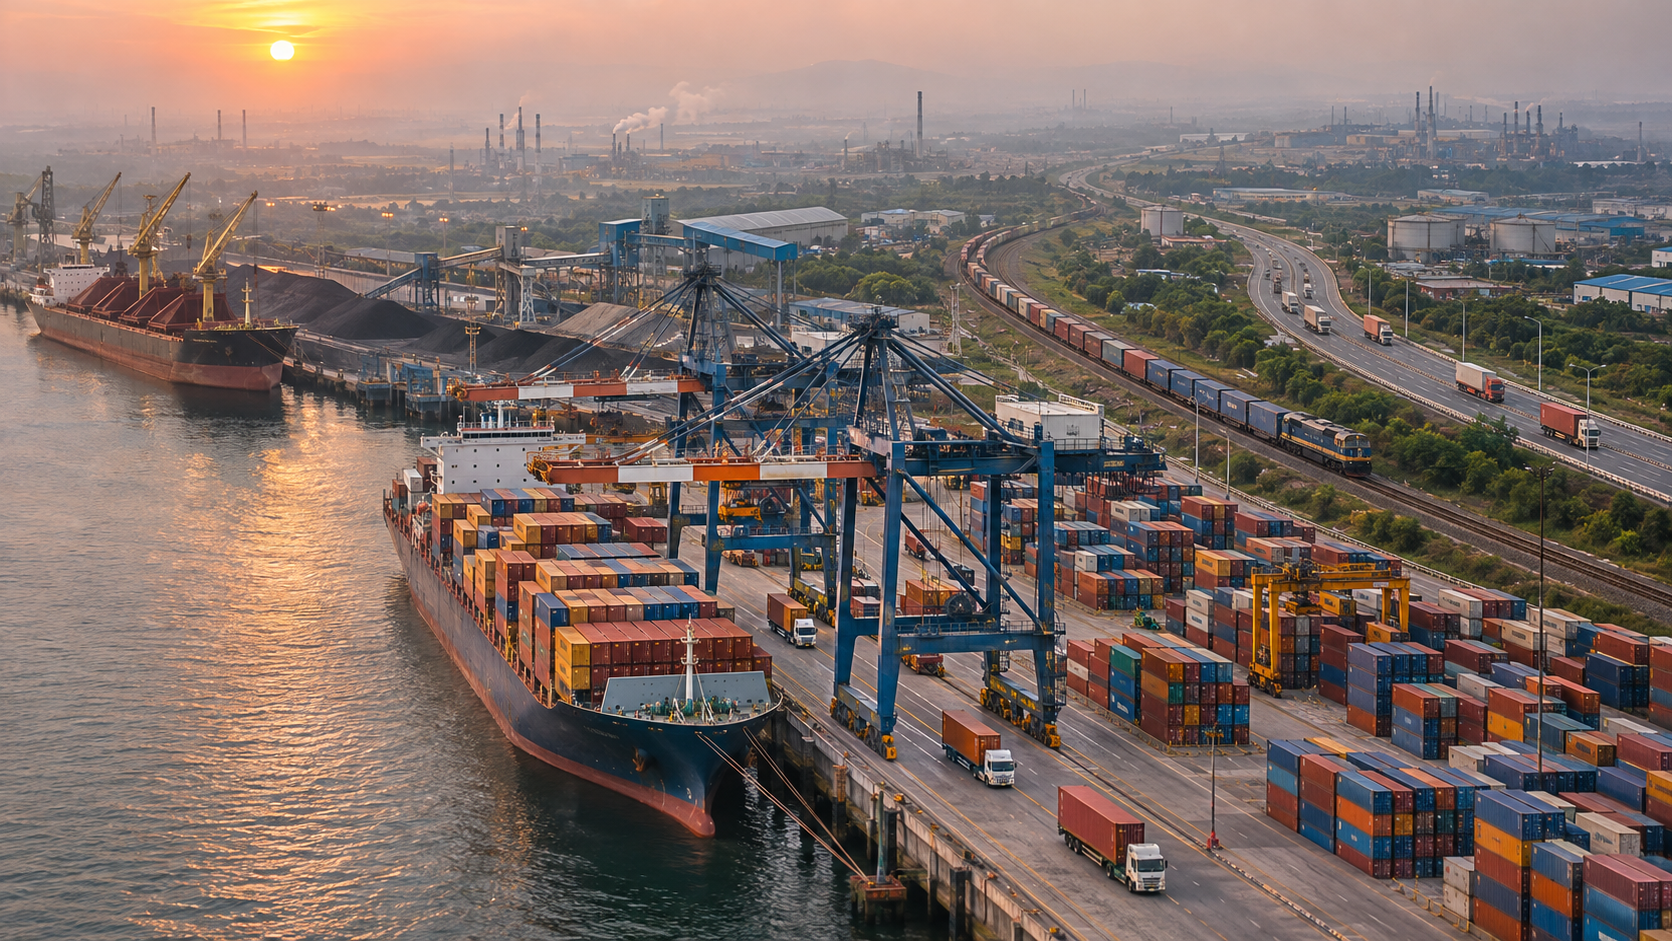
If you are trying to decide whether Bharat’s port progress is real, do not stop at photographs of new berths or announcements of added capacity. The stronger test is whether more cargo actually moves, ships spend less time in port, and goods travel reliably between the waterfront and the hinterland.
On those measures, the direction is encouraging. The unfinished work is also becoming clearer: the next large gains will come from the roads, railways, freight corridors, shipping services and operational handoffs that turn an efficient port into a dependable trade gateway.
Key takeaways
- Cargo handled by Bharat’s major and non-major ports rose 38%, from 1,209 million tonnes in FY18 to 1,668 million tonnes in FY26. This is actual throughput, not merely capacity announced or constructed.
- Handling capacity grew 22% to 2.8 billion tonnes per annum, while utilisation increased from 52% to 59%. Cargo therefore expanded faster than installed capacity, yet the system retains room for further growth.
- Average vessel turnaround at major ports fell 18% to about 49 hours, indicating that ships are being processed more quickly.
- At four core seaports, about 84% of measured export time occurs after export approval. The port gate, yard, loading sequence and connection to shipping services now deserve as much attention as the approval process itself.
The decisive change is cargo, not concrete
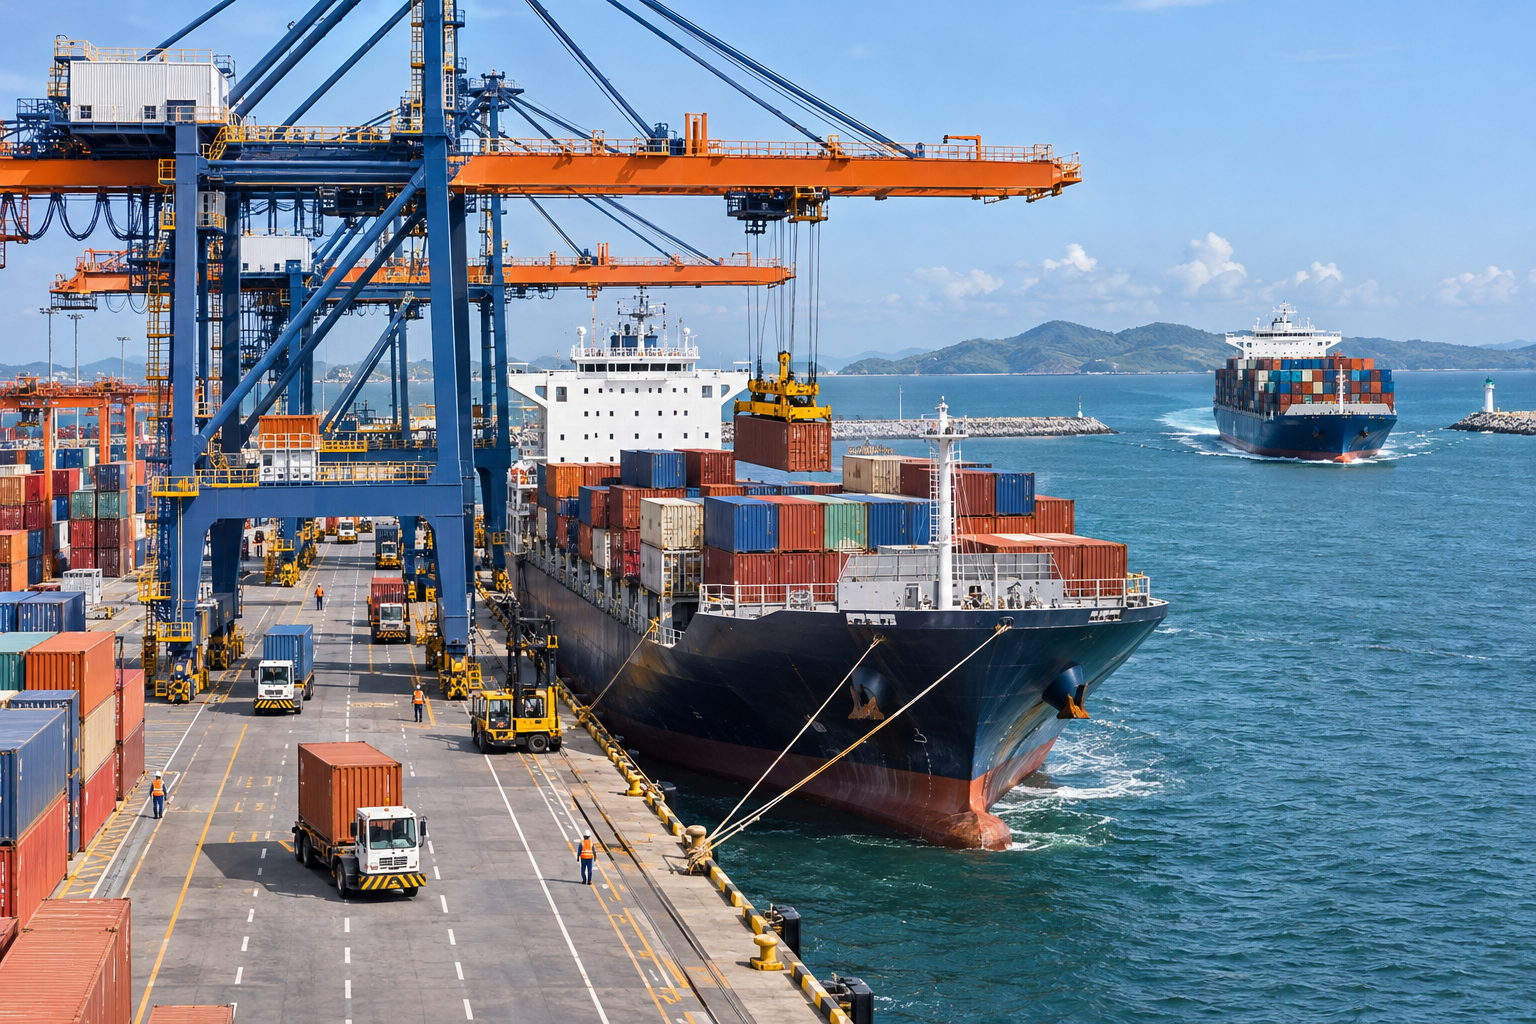
Four port measures are often mixed together even though they answer different questions. Capacity describes how much cargo the infrastructure is designed to handle. Throughput records what actually moved. Utilisation compares throughput with available capacity. Vessel turnaround measures the time required to process a ship in port.
Bharat’s recent record is meaningful because these measures moved in a coherent direction. Cargo grew faster than capacity, a larger share of installed capacity came into use, and ships were turned around more quickly. That combination is stronger evidence of operating improvement than capacity growth by itself. New infrastructure was not simply added to the national inventory; more trade flowed through it.
The remaining capacity headroom should not be mistaken for a problem. A port system needs some room to absorb rising demand, seasonal peaks and future industrial activity. But national headroom is not the same as usable capacity for every trader. Capacity at the wrong coast, in the wrong terminal type or without a reliable inland connection cannot automatically serve a cargo cluster elsewhere.
When you assess a port expansion, pair the capacity number with three questions: What cargo already uses the terminal? How much of its capacity is being used? How reliably can that cargo reach its origin or destination inland? If those answers are missing, the size of the new terminal tells you little about its economic value.
The next bottleneck lies between the factory gate and the ship
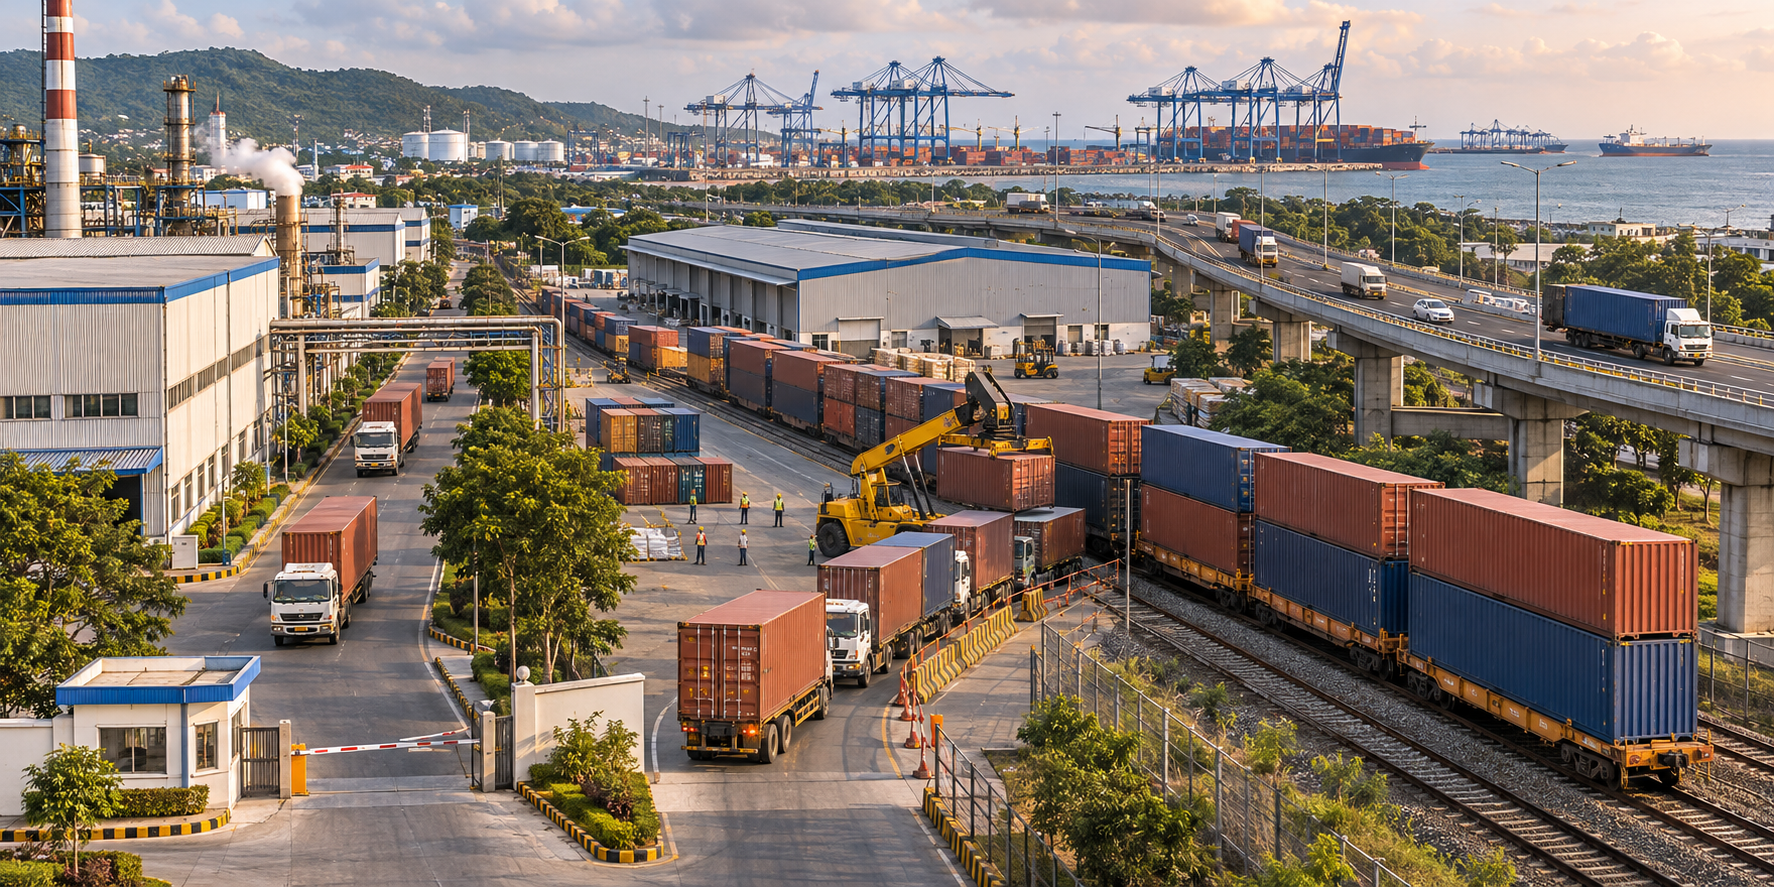
A ship can be handled efficiently while an export consignment still loses time elsewhere. Export approval is an administrative milestone, not the end of the logistics journey. Cargo must still move through the relevant handoffs, reach the terminal at the right time, be positioned for loading and connect with the intended sailing.
The concentration of measured export time after approval gives you a practical diagnostic rule: examine the sequence after clearance before demanding another round of paperwork reform. Break the journey into observable stages such as arrival at the port area, gate entry, terminal movement, loading and connection to the scheduled service. An end-to-end delay cannot be located by looking only at vessel turnaround.
Physical connectivity is improving, although the programme remains incomplete. Of 294 identified road and rail projects linking ports with their hinterlands, 84 had been completed by July 2026. The 1,506-kilometre Western Dedicated Freight Corridor connecting JNPA with Dadri was commissioned in March 2026. That corridor is a major addition, but one commissioned trunk route cannot resolve every last-mile constraint around every port.
Project counts also need context. A short missing link carrying a large share of a port’s cargo may matter more than a longer project on a lightly used route. Priorities should therefore follow observed cargo flows: where the goods originate, which mode they use, where congestion appears, which terminal handles them and which shipping service they must meet.
If you operate in a port-linked supply chain, map that physical journey before choosing a gateway. Do not compare ports solely by their waterfront statistics. Compare the complete route from plant or warehouse to terminal, including the reliability of the rail or road connection and the availability of a suitable shipping service. A faster berth cannot recover time already lost inland.
Different gateways require different scorecards
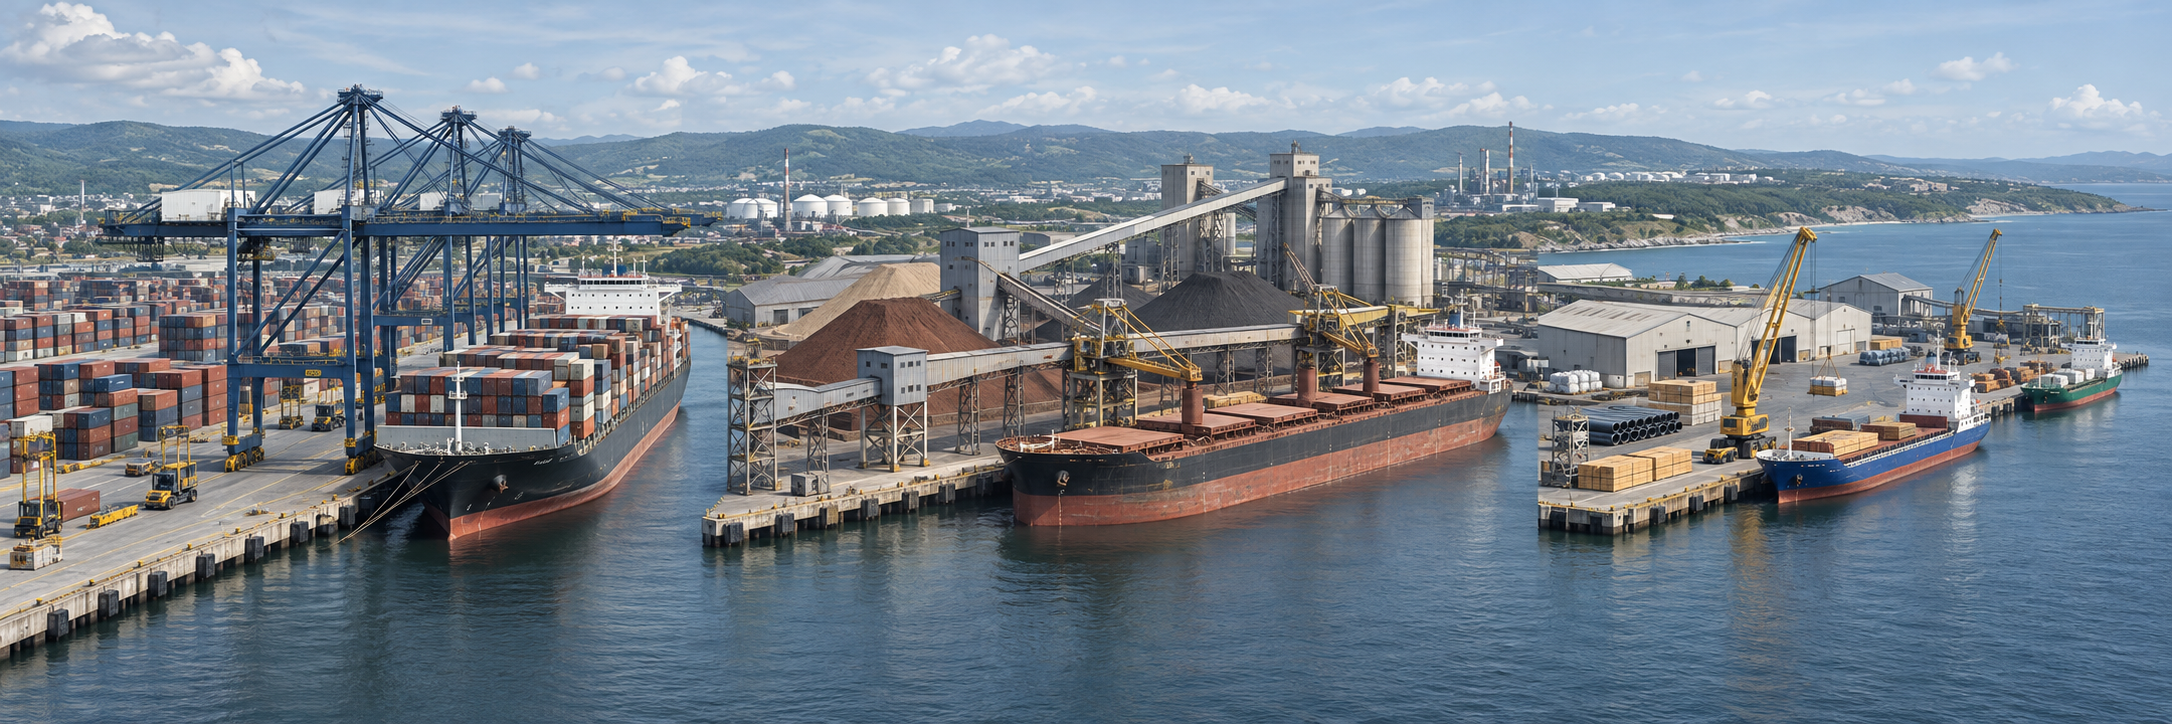
Bharat should not demand the same operating model from every port. The emerging maritime agenda distinguishes among container gateways, transshipment hubs, industrial and energy gateways, and specialised export corridors. Each serves a different cargo flow, so each should be judged by a different primary question.
Container gateways: can the box make its sailing reliably?
For a container gateway, quick ship handling matters, but it is only one link in the chain. You should also examine whether containers reach the terminal predictably, whether the inland mode has enough practical capacity and whether appropriate shipping services call regularly. A terminal can have spare capacity and efficient cranes yet remain a weak choice for a shipper whose cargo repeatedly misses its intended connection.
Transshipment hubs: are onward connections deep enough?
A transshipment hub transfers containers between services. Its usefulness therefore depends on connectivity to onward sailings, not merely on the volume that crosses its quay. The question is whether shipping networks can move cargo onward with sufficiently dependable timing. Infrastructure creates the possibility of a hub; service connectivity makes the hub commercially relevant.
Industrial and energy gateways: does the port fit its hinterland?
An industrial or energy gateway must align with the production and consumption network it serves. Look for a clear relationship between terminal capability, the relevant industrial users and the inland evacuation route. A large national capacity figure cannot compensate for a mismatch among cargo type, terminal equipment and hinterland demand.
Specialised export corridors: has the whole commodity journey been designed?
A specialised corridor should be organised around the needs of its cargo rather than around a generic port template. Trace the export from its production cluster through consolidation, required handling, inland transport, terminal processing and the shipping schedule. Where a commodity needs controlled conditions or time-sensitive movement, those requirements belong in the corridor design from the beginning.
A practical scorecard for Bharat’s next maritime phase
Private participation is already substantial. Privately run terminals handle about two-thirds of cargo at major ports, against a target of 85% by 2030. The target describes an operating model, however, not an economic result. The useful test is whether that participation produces better throughput, turnaround, service connectivity and end-to-end reliability.
International performance signals are encouraging as well. JNPA, Pipavav and Mundra rank among the top 30 in the World Bank’s Container Port Performance Index 2025. Their presence demonstrates that high-performing Indian container gateways are achievable. It does not establish that every port, cargo category or inland corridor performs at the same level.
Use these five questions when you encounter the next claim about port development:
- What is the scope? Check whether the number covers major ports, non-major ports, container terminals or all cargo. Figures with different scopes should not be treated as interchangeable.
- Is the claimed gain an input or an outcome? New capacity is an input. Cargo moved, time saved and reliable connections are outcomes.
- Where does the time measurement begin and end? Vessel turnaround, port dwell and the exporter’s complete transit time describe different parts of the journey.
- Does the connectivity project follow an actual cargo flow? Identify the production cluster, port, terminal, inland route and shipping service that the project joins.
- Is better performance spreading beyond the leading gateways? A national maritime system becomes resilient when successful operating practices extend across corridors rather than remaining isolated at a few ports.
Bharat has reached the point where a new berth alone should no longer be accepted as proof of maritime progress. Watch what happens after export approval and beyond the port gate. If those handoffs become faster while cargo, utilisation and shipping connectivity keep strengthening, Bharat’s ports will be doing more than handling larger volumes: they will be supporting a more dependable national trading system.
References
- Hindu Post — Bharat’s Ports Handle 38% More Cargo Than in FY18, Says FICCI-Kearney Report
- India Brand Equity Foundation — Logistics Links and Shipping Services Emerge as Key Drivers of India’s Maritime Growth: FICCI-Kearney Report

Leave a Reply
You must be logged in to post a comment.