
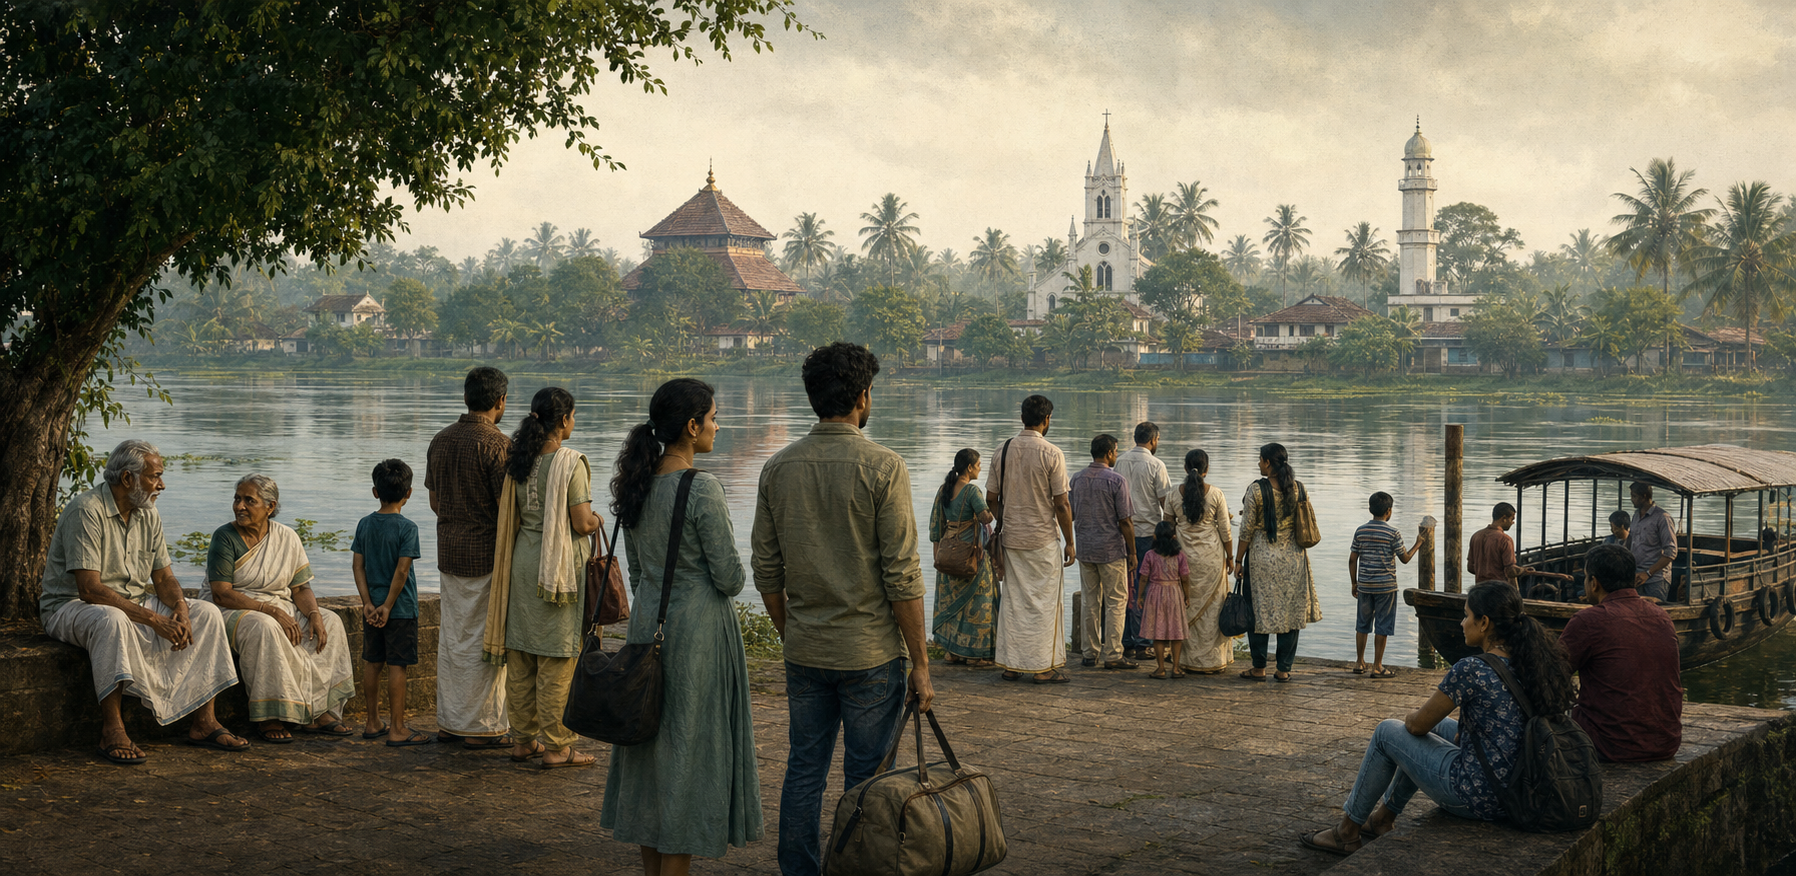
You may have encountered the stark claim that deaths now exceed births among Kerala’s Hindus and Christians while Muslims still record natural increase. If you are trying to decide whether this is a temporary statistical wrinkle or a lasting civilizational concern, do not begin with a slogan. Begin with the population equation and the age structure behind it.
The divergence is real enough to matter. It is not, however, proof that one community has suddenly become unhealthy, that another will grow at its current pace forever, or that Kerala’s religious future can be read from a single annual balance. The state is seeing different communities reach the same demographic transition at different times, with migration widening the gap.
Natural decrease is a threshold, not disappearance

Natural population growth has a narrow meaning: births minus deaths during a defined period. If a community records 100 births and 110 deaths, its natural balance is negative by 10. That figure does not include people entering or leaving Kerala. Total population change equals the natural balance plus net migration.
This distinction changes how you should read the headline. A community can have more deaths than births while its total population remains stable if migration offsets the difference. Another community can have more births than deaths but still lose residents if enough people move away. A natural balance is an important flow for one period; it is not a complete population count.
Kerala’s statewide fertility has been low for a long time. NFHS-5 placed the total fertility rate near 1.8 in 2019-21, compared with 1.6 in NFHS-4 in 2015-16. The modest rise between those survey rounds did not end the state’s below-replacement pattern.
A total fertility rate is not the annual population growth rate, nor is it a count of children already born to every woman. It summarizes the fertility rates observed across reproductive ages during a period. Annual births also depend on how many women are in those ages. Two communities can have similar fertility behavior and still record very different birth totals if one has a much larger generation of potential parents.
Deaths work in the same way. An older population will ordinarily record more deaths than a younger population, even when people at every age are living longer and receiving better care. That is why a rising crude death rate can coexist with improving age-specific survival. The rate rises because more residents have reached ages at which death is naturally more common, not necessarily because the health system has deteriorated.
Negative natural growth is therefore a meaningful threshold in population arithmetic, but it is not a countdown to extinction. It tells you that a community’s current age structure and fertility pattern are producing fewer births than deaths. To understand what happens next, you still need migration, age-specific rates and the size of each generation.
Why Kerala’s communities crossed the line at different times
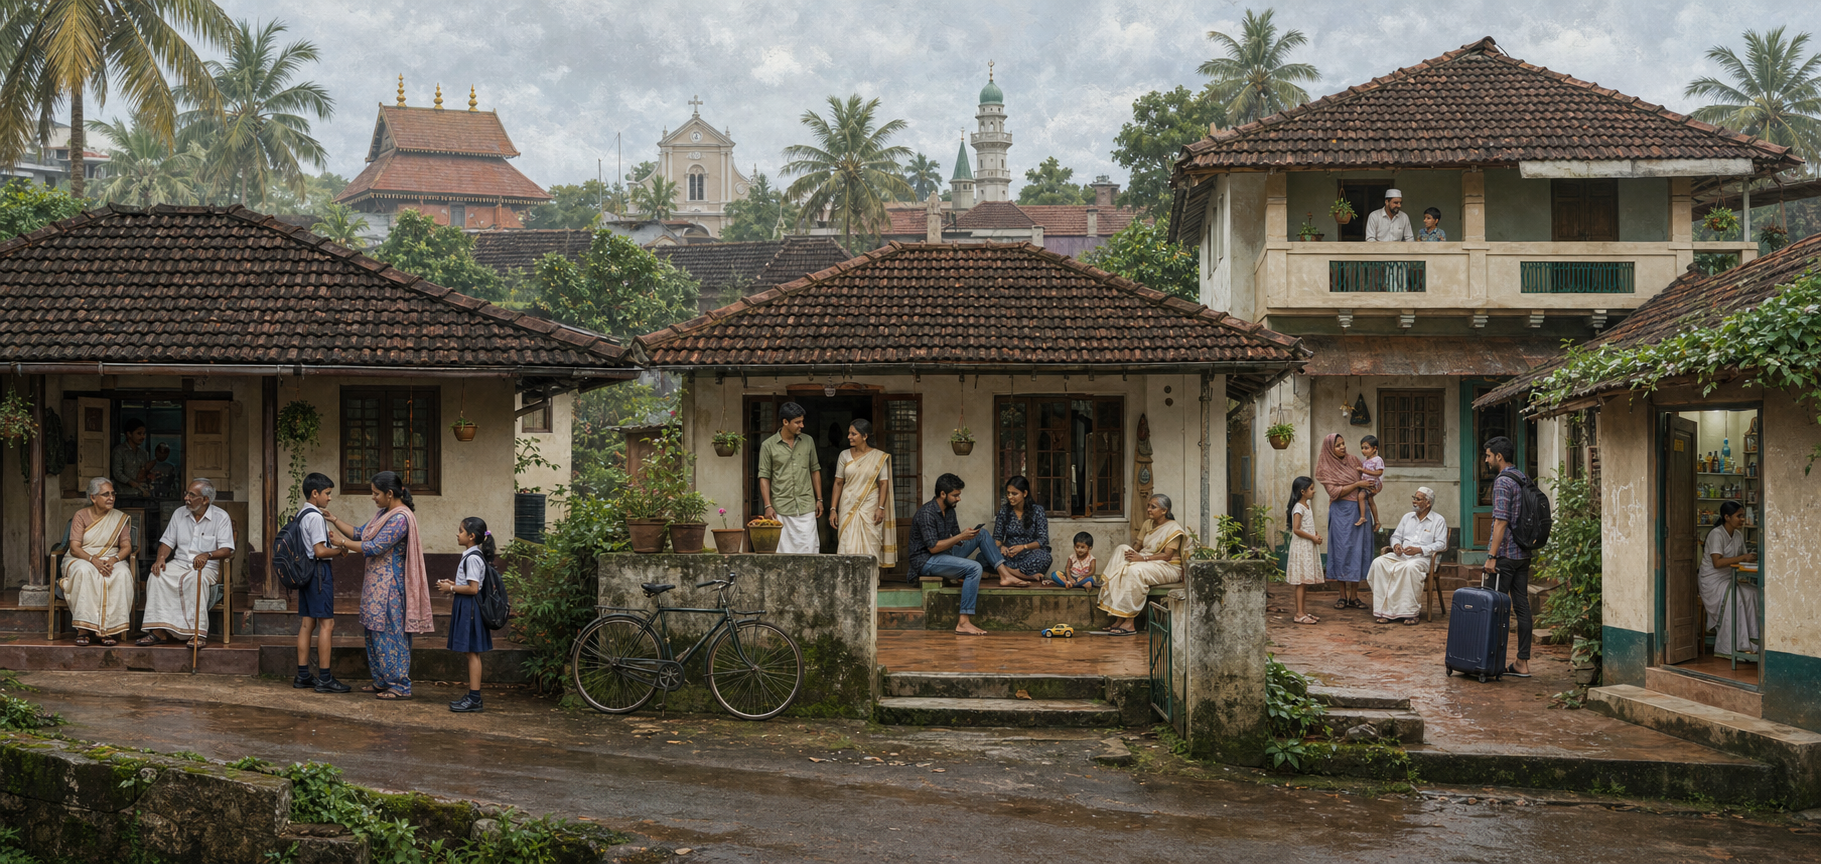
Kerala’s religious communities do not begin from identical age pyramids. Hindus and Christians have, on average, older profiles because their fertility declined earlier and because many younger adults left Kerala for education and employment. Muslims also experienced substantial fertility decline, but retain a younger age distribution and somewhat higher fertility. That combination currently produces more births and fewer deaths relative to population size.
This is demographic momentum. A large young generation can sustain a positive natural balance even while the number of children per woman is falling. A smaller generation entering parenthood can produce fewer births even if its fertility rate stops declining. Likewise, a large elderly generation can push deaths above births while longevity continues to improve.
The present difference should not be dismissed. If unequal natural balances persist, they can change relative community shares and affect the future membership of schools, temples, churches, mosques, associations and political constituencies. But the current gap is not a permanent growth law. Fertility differences among Kerala’s communities have narrowed over time, so a projection that simply extends today’s rates indefinitely will exaggerate certainty.
Migration sharpens the religion-specific timing. When a young adult moves to another Indian state or to the Gulf, any children born while that person lives elsewhere may not appear in Kerala’s birth total. If that person returns to Kerala later in life, the return adds an older resident and may eventually add a death without having added the corresponding births. Nothing has been counted dishonestly; the location and timing of life events have changed.
This has been especially consequential for communities with earlier educational gains and greater labor mobility. It also means that policies focused only on persuading couples to have more children miss part of the mechanism. If people in their main family-forming years cannot find suitable work, housing or childcare in Kerala, the state may continue to export potential parents even when those couples do have children.
Statewide religious averages also conceal large internal differences. Historically low-fertility districts such as Pathanamthitta and Kottayam have particularly old population profiles and low birth counts. District, income, education, occupation and migration history can separate two families of the same faith more sharply than a statewide label suggests.
If you are planning for a local temple, school or community organization, do not substitute the statewide Hindu balance for local evidence. Ask how many members fall into five-year or ten-year age bands, how many young adults live outside the district, and whether recent enrollment or participation changes have continued for several years. Local age structure determines the institution’s immediate needs.
Use five questions to test any demographic claim

Religious demography attracts dramatic charts because crude totals are easy to publish and easy to misuse. Before accepting either an alarmist forecast or a soothing dismissal, put the claim through these five checks.
- Is this natural growth or total population change? Look for births, deaths and net migration as separate components. If migration is missing, the claim cannot establish how the total resident population changed.
- Are the rates adjusted for age? Crude birth and death rates describe events in the whole population. They do not isolate behavior or health from age composition. A fair comparison needs age-specific rates or an explicit age-standardization.
- What period and denominator are being used? An absolute count, a rate per population and a percentage change answer different questions. One unusual year should not be treated as a durable trend without several comparable periods.
- Did the quality or timeliness of registration change? Kerala has highly complete civil registration, but even a small improvement can raise reported deaths because previously missed or delayed events are now captured. That is better measurement, not automatically worse mortality.
- Does a projection disclose its assumptions? A credible cohort projection moves every age group forward and applies age-specific fertility, mortality and migration. Extending a current religious percentage along a straight line is not an adequate substitute.
The Civil Registration System, Sample Registration System and NFHS serve different purposes. Annual registrations show recorded events; the SRS supplies demographic indicators; NFHS helps establish fertility and household patterns. Reading them together is more reliable than asking one dataset to answer every question.
| Measure | What it tells you | What it cannot establish alone |
|---|---|---|
| Annual natural balance | Whether births exceeded deaths during the period | Total population change after migration |
| Total fertility rate | The period pattern of age-specific fertility | The number of births without the size of reproductive-age cohorts |
| Crude death rate | Deaths relative to the whole population | Whether health worsened without accounting for age |
| Age-by-religion population | The size and shape of each community’s generations | The future path without assumptions about rates and migration |
| Net migration | The balance of people entering and leaving | Its effect on ageing unless migrants are also grouped by age |
The largest remaining gap is transparent age-by-religion population data. When the next detailed Census tables become available, the useful question will not be merely which faith gained or lost share. Look for the size of child, working-age and elderly cohorts within each community. Those cohorts determine whether an annual imbalance is likely to deepen, stabilize or reverse.
A pro-Dharmic response joins continuity with care
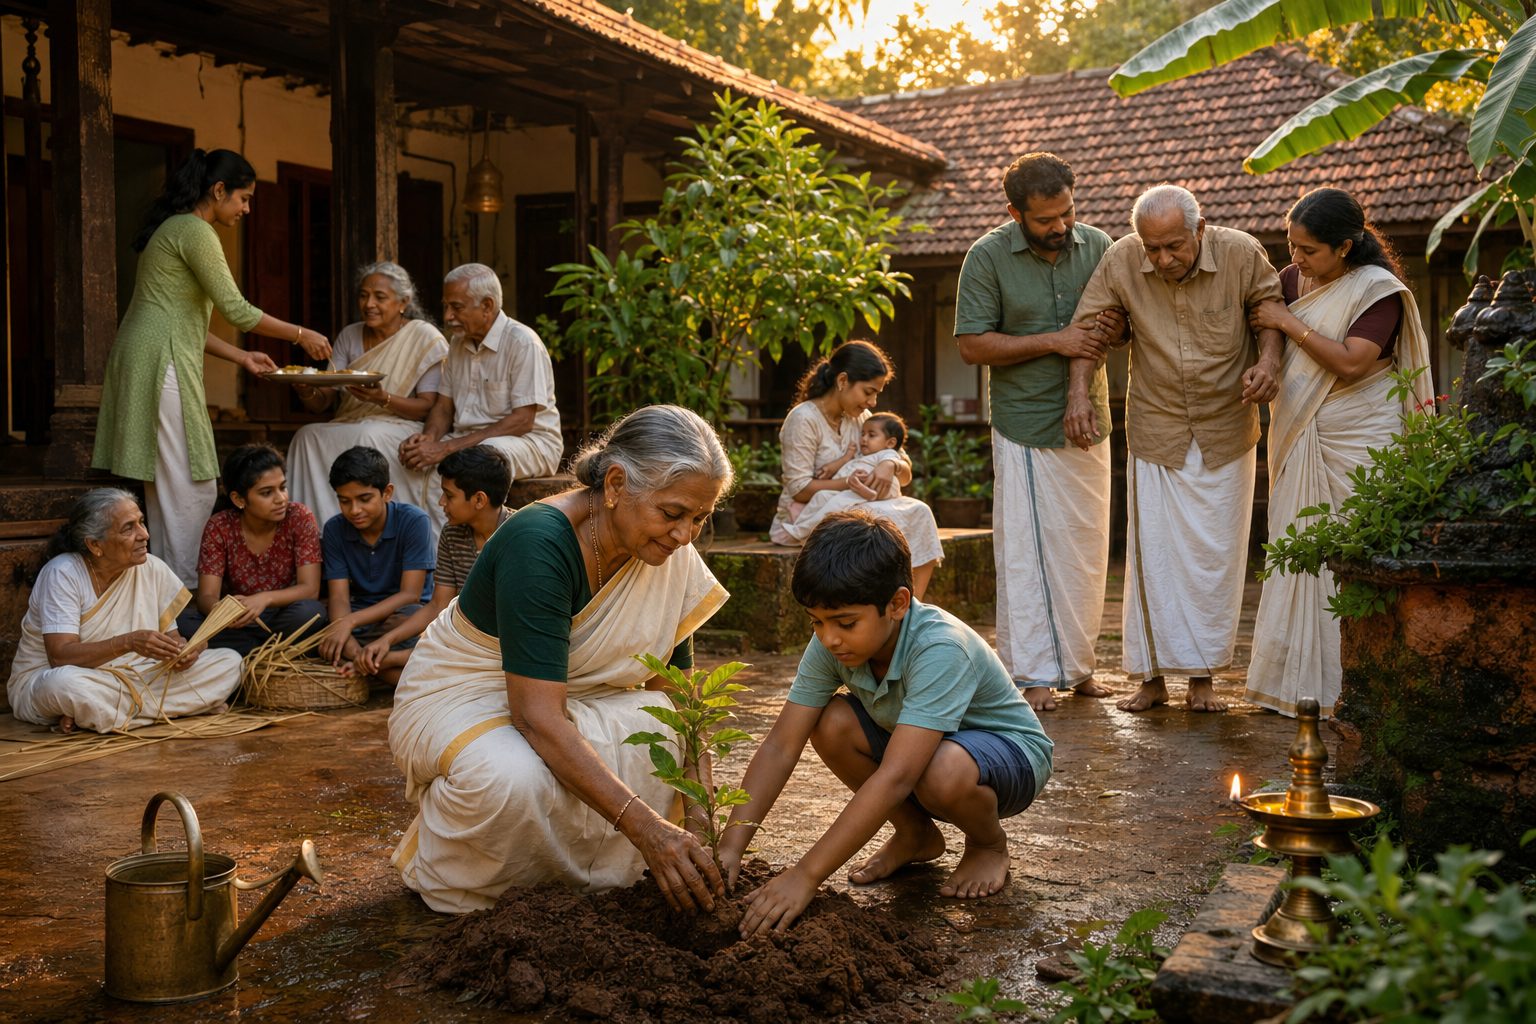
Concern for Hindu demographic continuity is legitimate. It becomes poor analysis when a temporary age-structure advantage is treated as proof of permanent hostile intent, or when coercion is presented as family policy. A serious Dharmic response protects the freedom and stability of young families while honoring the elders whose longevity helped create the transition.
Help families have the children they already want
Low fertility in Kerala is tied to high education, the cost of urban housing, dual-earner aspirations, postponed family formation and the opportunity cost of childcare. The practical response is to remove those constraints. Affordable childcare, parental leave, flexible work, housing near employment hubs and reliable early-childhood education give couples more room to realize their own family plans.
- Match childcare availability to actual work and commuting hours, not only conventional school hours.
- Make parental leave and flexible work usable by fathers as well as mothers, so family formation does not fall entirely on women’s careers.
- Connect housing assistance to places where younger adults can find durable employment.
- Use temples and community organizations to build vetted childcare networks, practical support for new parents and links to public services.
The right test is whether a measure reduces a documented burden without dictating a religious quota or an intimate family decision. Pressure campaigns may create resentment while leaving housing, employment and care costs untouched.
Prepare institutions for an older membership
Even an effective family policy will not make an old age pyramid young next year. Kerala must prepare for more eldercare, geriatric medicine, home-based support and palliative services at the same time that it supports parents. The state already has strengths in education, nursing and care work that can be directed toward a dignified eldercare economy.
- Temples and neighborhood groups can maintain voluntary contact lists for isolated elders, organize transport support and connect families with qualified care providers.
- Health planning should expand geriatric and home-based palliative capacity where the elderly share is already high.
- Schools should track several years of cohort data before consolidating facilities, while planning shared use for smaller classes where decline is sustained.
- Training in nursing, rehabilitation and care work can meet local needs while creating employment that may help retain younger adults.
- Public spaces, transport and service counters should be designed for residents with reduced mobility, not treated as afterthoughts.
Protect public trust with better data
Kerala should publish religious demographic figures with the age structure, district context, period and registration notes needed to interpret them. Historical observations must be separated from model projections. Every projection should state its fertility, mortality and migration assumptions clearly enough for another analyst to reproduce the direction of the result.
This standard protects legitimate Hindu interests more effectively than inflated claims do. A Muslim community with a younger age structure is not, for that reason alone, evidence of a coordinated design. A Hindu community with negative natural growth is not, for that reason alone, destined to disappear. Neither statement survives basic demographic scrutiny.
There is still a real planning problem. A prolonged natural decrease can shrink younger Hindu cohorts, raise the burden on working-age households and weaken institutions that fail to adapt. Facing that possibility early is prudent. Turning neighbors into demographic abstractions is not.
Key takeaways
- Negative natural growth means deaths exceeded births during a defined period; it does not include migration.
- Kerala’s Hindu and Christian balances reflect older age profiles, long-standing low fertility and the out-migration of younger adults.
- The Muslim balance remains positive because of a younger age structure and relatively higher fertility, but fertility has been declining and community differences have narrowed.
- A higher crude death rate in an older community does not by itself show declining health or shorter lives.
- One annual balance cannot predict a community’s eventual size or share; credible projections need age-specific fertility, mortality and migration.
- The workable response is voluntary family support, serious eldercare, local institutional planning and transparent data.
When the next demographic claim reaches you, run the five checks before forwarding it. Then ask one concrete local question: is your community missing childcare, nearby employment and housing, elder support, or usable age data? Acting on that answer turns demographic concern into intergenerational responsibility.
References
