
You see a poverty number used as a victory slogan. Then someone points to a family in distress and declares the number false. Neither reaction helps you judge what actually changed in Bharat.
The evidence supports a confident but disciplined conclusion: Bharat achieved an exceptionally large reduction in poverty between 2011 and 2023. That progress is real. It is also incomplete, measured against specific thresholds, and increasingly concentrated in one part of the country. Knowing those distinctions lets you defend the achievement without pretending the work is finished.
Two poverty lines tell two different stories
The first number to understand is the extreme-poverty measure. Between 2011 and 2023, poverty measured at the $3 line declined by 24.5%. The pace placed Bharat among the countries recording the fastest poverty reductions in the world during that period.
The second number uses the higher $4.20 benchmark associated with lower-middle-income poverty. At that line, the poverty rate fell by 41.6%, representing about 496 million people moving above the threshold. The underlying estimates come from the World Bank.
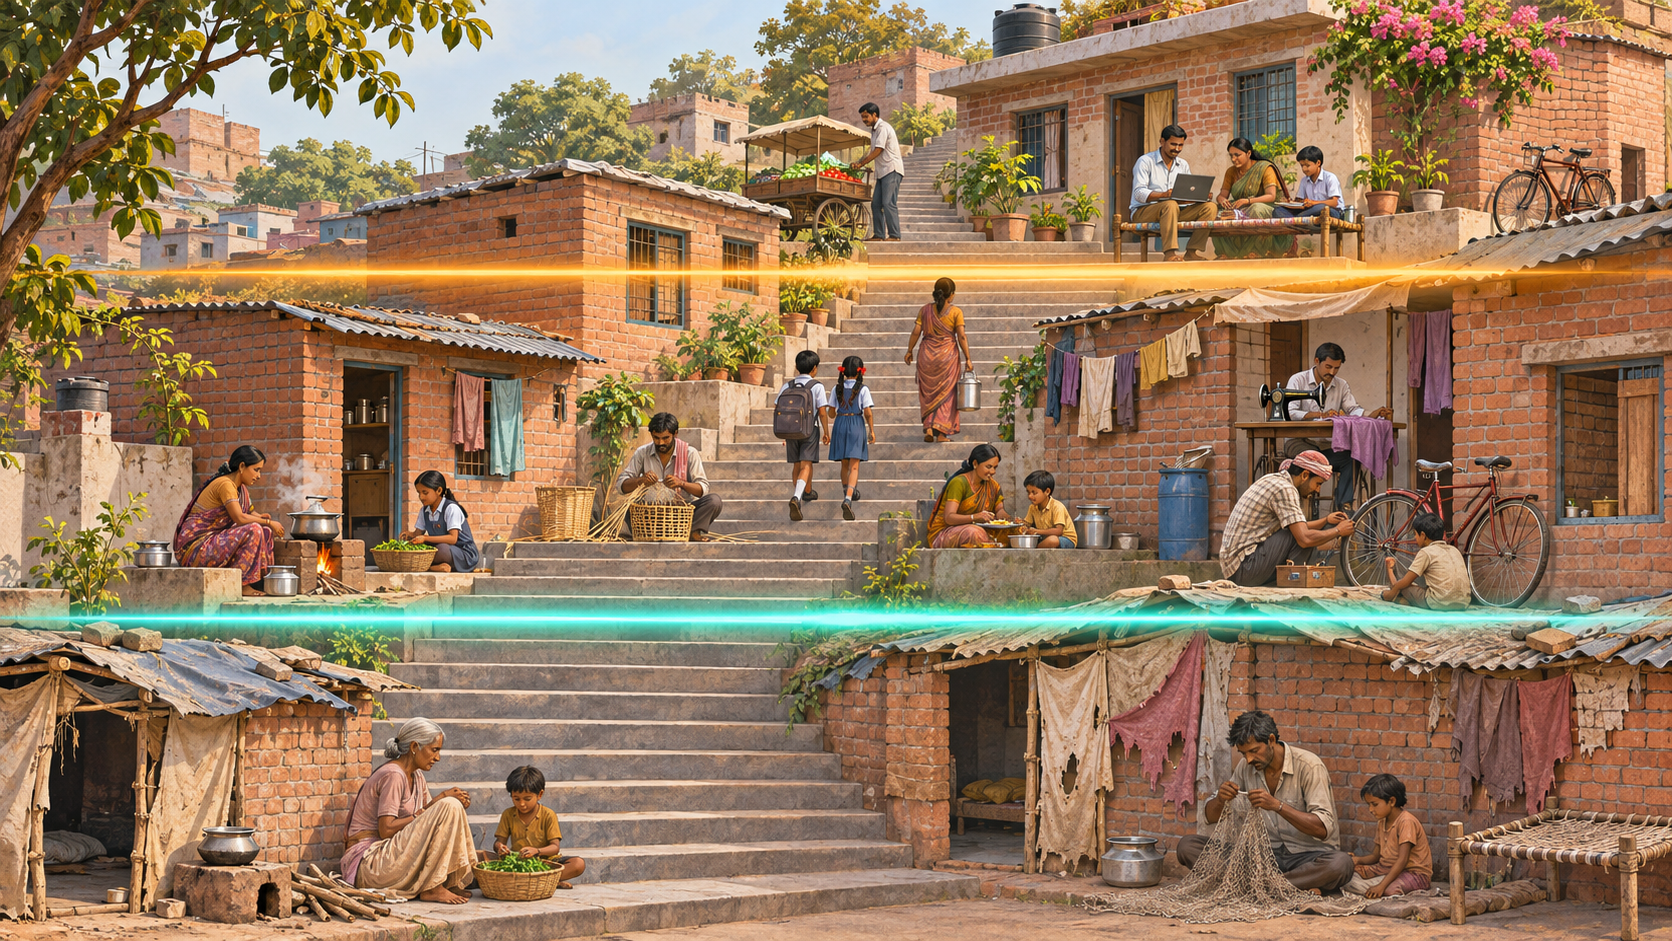
These figures describe different levels of deprivation. They should not be merged, added together, or quoted without identifying the relevant line. Someone can rise above the $3 threshold while remaining below $4.20. That person is no longer counted as extremely poor under the first measure, but is still poor under the second.
Crossing either line also does not automatically mean that a person has entered the secure middle class. A poverty line is a statistical cutoff, not a complete description of a household’s life. It does not tell you how far above the cutoff the household has moved, whether its income is stable, or whether one setback could erase the gain.
This distinction protects you from two common errors. The first is to dismiss a major decline because hardship remains visible. The second is to treat movement above a minimum threshold as proof that material insecurity has disappeared. Bharat’s achievement needs neither denial nor exaggeration.
Growth, women’s employment and food support worked together
No single lever adequately explains a transformation of this size. Three forces stand out: consumption growth, rising employment with a notable increase among women, and expanded food subsidies.
- Consumption growth matters because poverty measures track whether households command enough resources to cross the relevant monetary threshold. Broad improvement in consumption therefore reaches the measure directly.
- Employment matters because durable poverty reduction depends on households gaining a stronger connection to productive economic activity. Women’s entry into work is especially consequential when it adds another earning pathway to a household.
- Food subsidies matter because essential food consumes a large share of a poor household’s limited resources. Support for that necessity can protect basic consumption even when earnings remain low or uneven.
The interaction is more important than any one item. Employment and consumption growth can move households upward. Food support can establish a floor beneath those who have not yet benefited sufficiently from economic expansion. One creates opportunity; the other reduces the danger that severe deprivation will overwhelm a family before opportunity reaches it.
This gives you a practical test for political claims. If someone attributes the entire decline only to economic growth, ask where employment and food support fit. If someone credits only welfare transfers, ask how consumption growth and work contributed. A serious explanation has to account for all three channels rather than selecting whichever one suits an ideological preference.
The same test should shape future policy. Food support cannot substitute indefinitely for productive employment, but employment gains do not make a basic safety net irrelevant. Bharat needs a floor that prevents extreme deprivation and a ladder that allows households to become economically independent.
The national average conceals an eastern concentration

The sharp national decline does not mean progress has been evenly distributed. Roughly 57% of Bharat’s poor now live in a contiguous belt stretching from Uttar Pradesh to West Bengal. That concentration identifies where the next phase will be won or lost.
Read the 57% figure carefully. It is the share of the country’s poor population living in that belt; it is not a claim that 57% of everyone in the belt is poor. Nor does it mean that every state or district within the region has the same poverty rate. Population size, the number of poor people and the percentage of residents who are poor are related measures, but they are not interchangeable.
This geographic concentration changes the question you should ask. At the national level, the question is whether Bharat made progress. It plainly did. At the regional level, the question is whether the mechanisms behind that progress are reaching the remaining centres of deprivation with enough force.
For that belt, three local tests follow directly from the national experience:
<!– wp:list {
Leave a Reply
You must be logged in to post a comment.